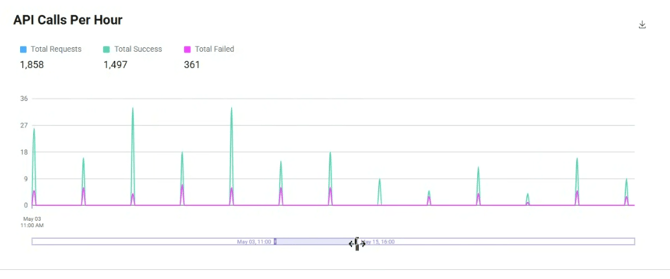
.jpg?width=218&height=98&name=Core42_Primary_Logo_RGB_Grit_Green_and_Impact_Green_Duo-Tone%20(2).jpg)
The Usage Reports page visually represents your API usage, including information on models, keys, duration, success and failed calls, token consumption details, and web search transactions. You can filter the usage data by model ID and duration using the dropdown at the top-right corner of the page.
To access the Reports page, log in to your account and click your Workspace > Usage Reports. The Overview tab provides a consolidated view of platform usage insights across Cost, Tokens, Images, Videos, Audio, and API Requests. Users can monitor usage trends, compare usage growth across selected time periods, and analyze model consumption through interactive visualizations.
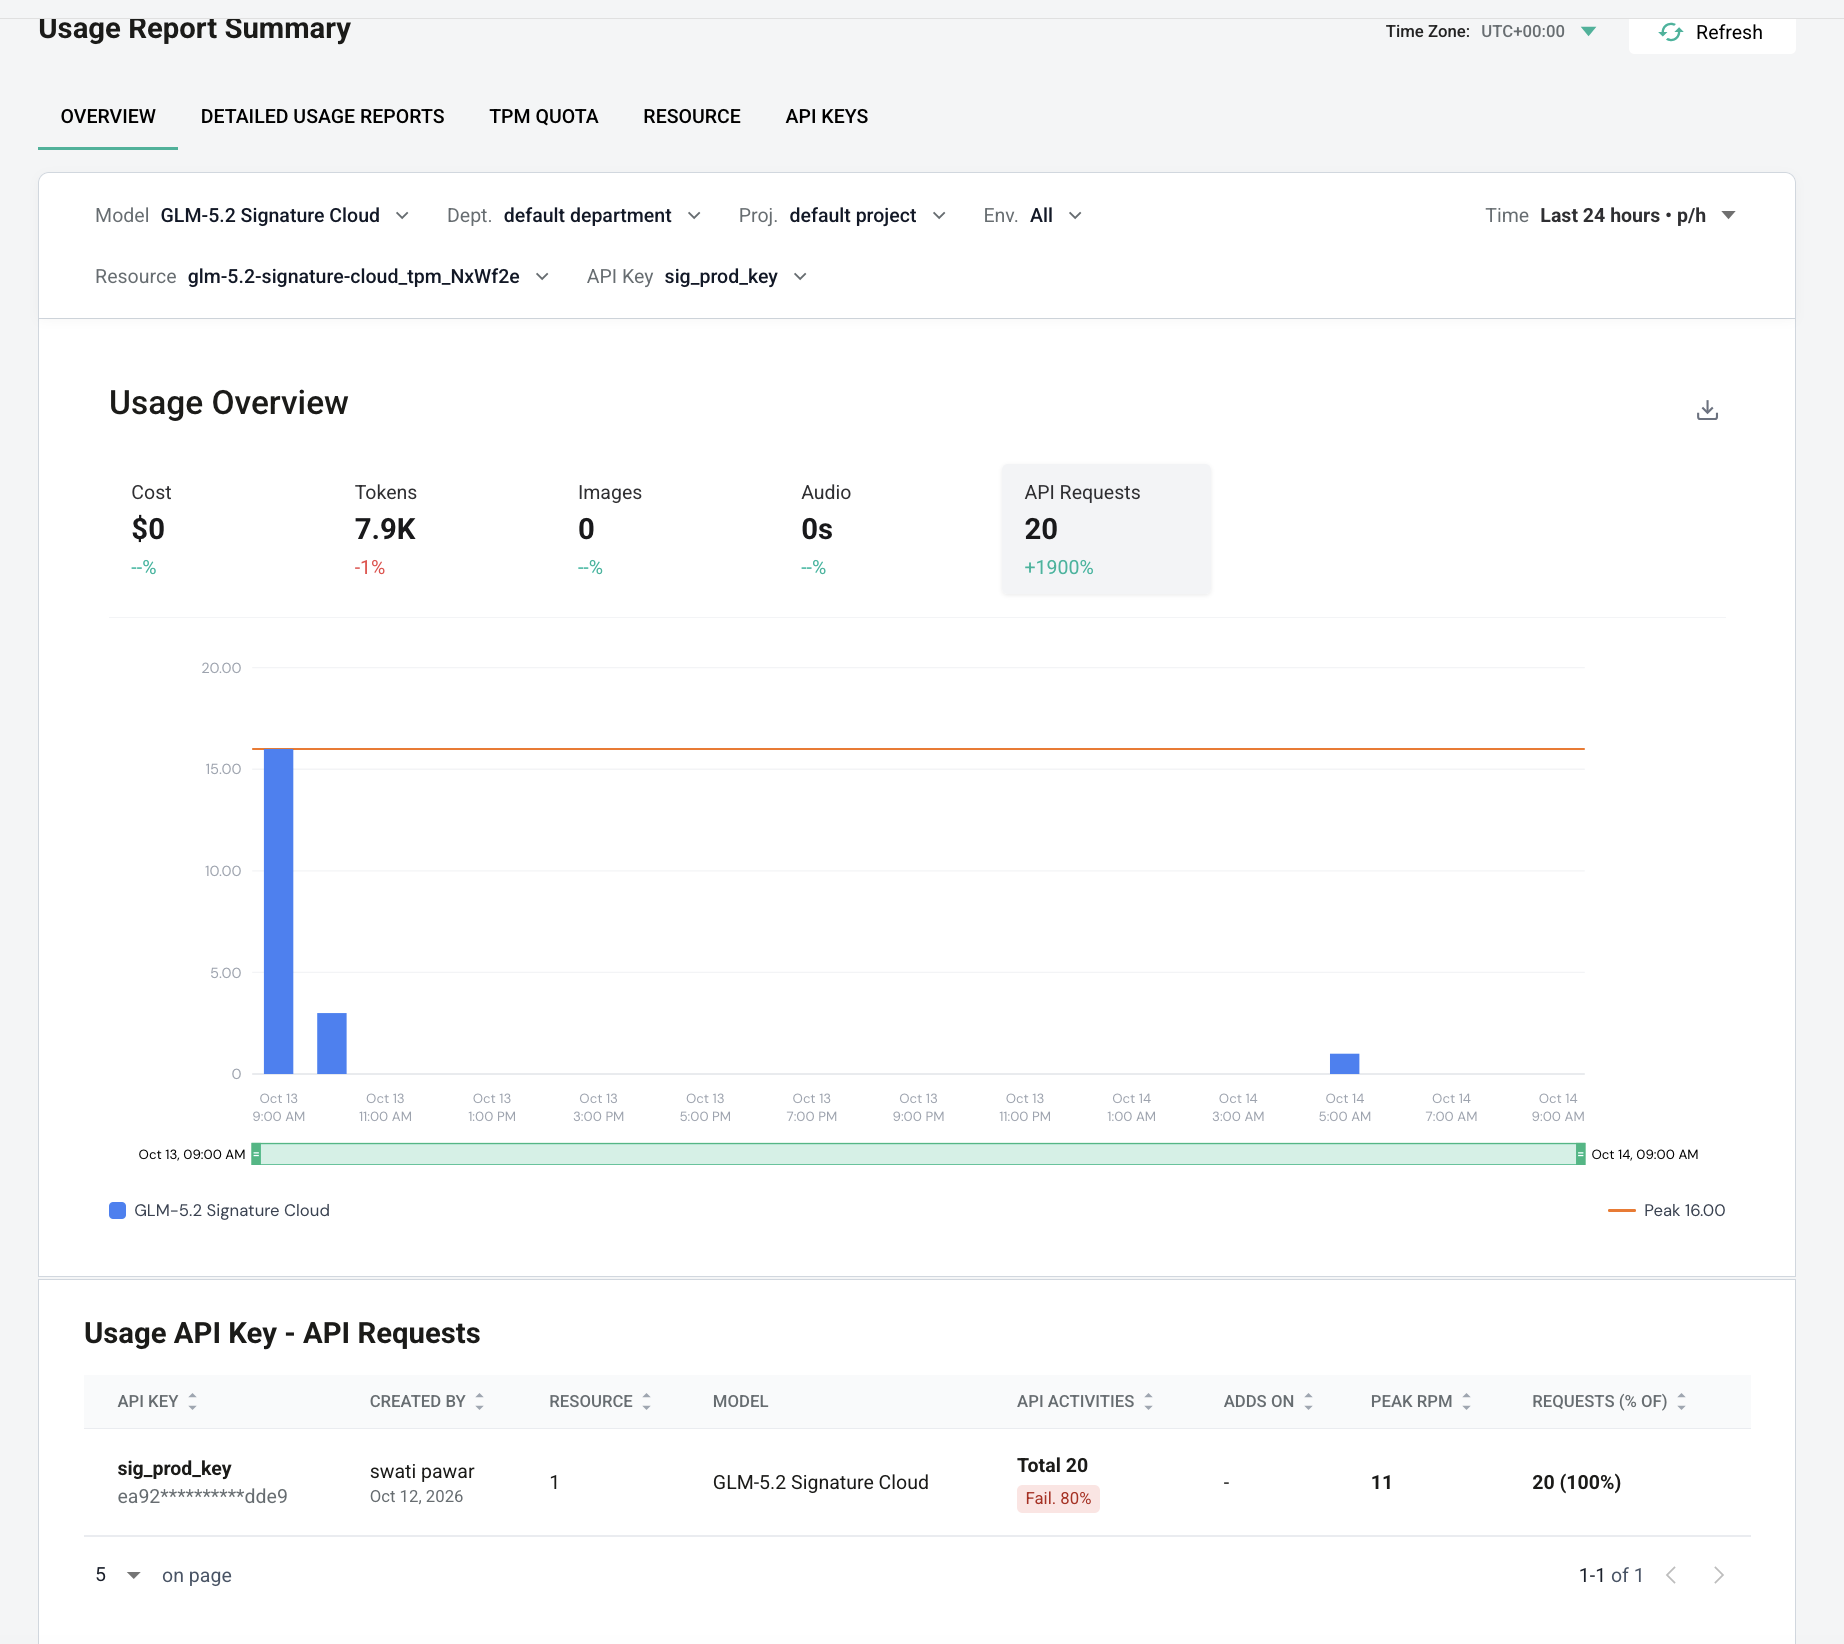
The cost TPM appears as below:
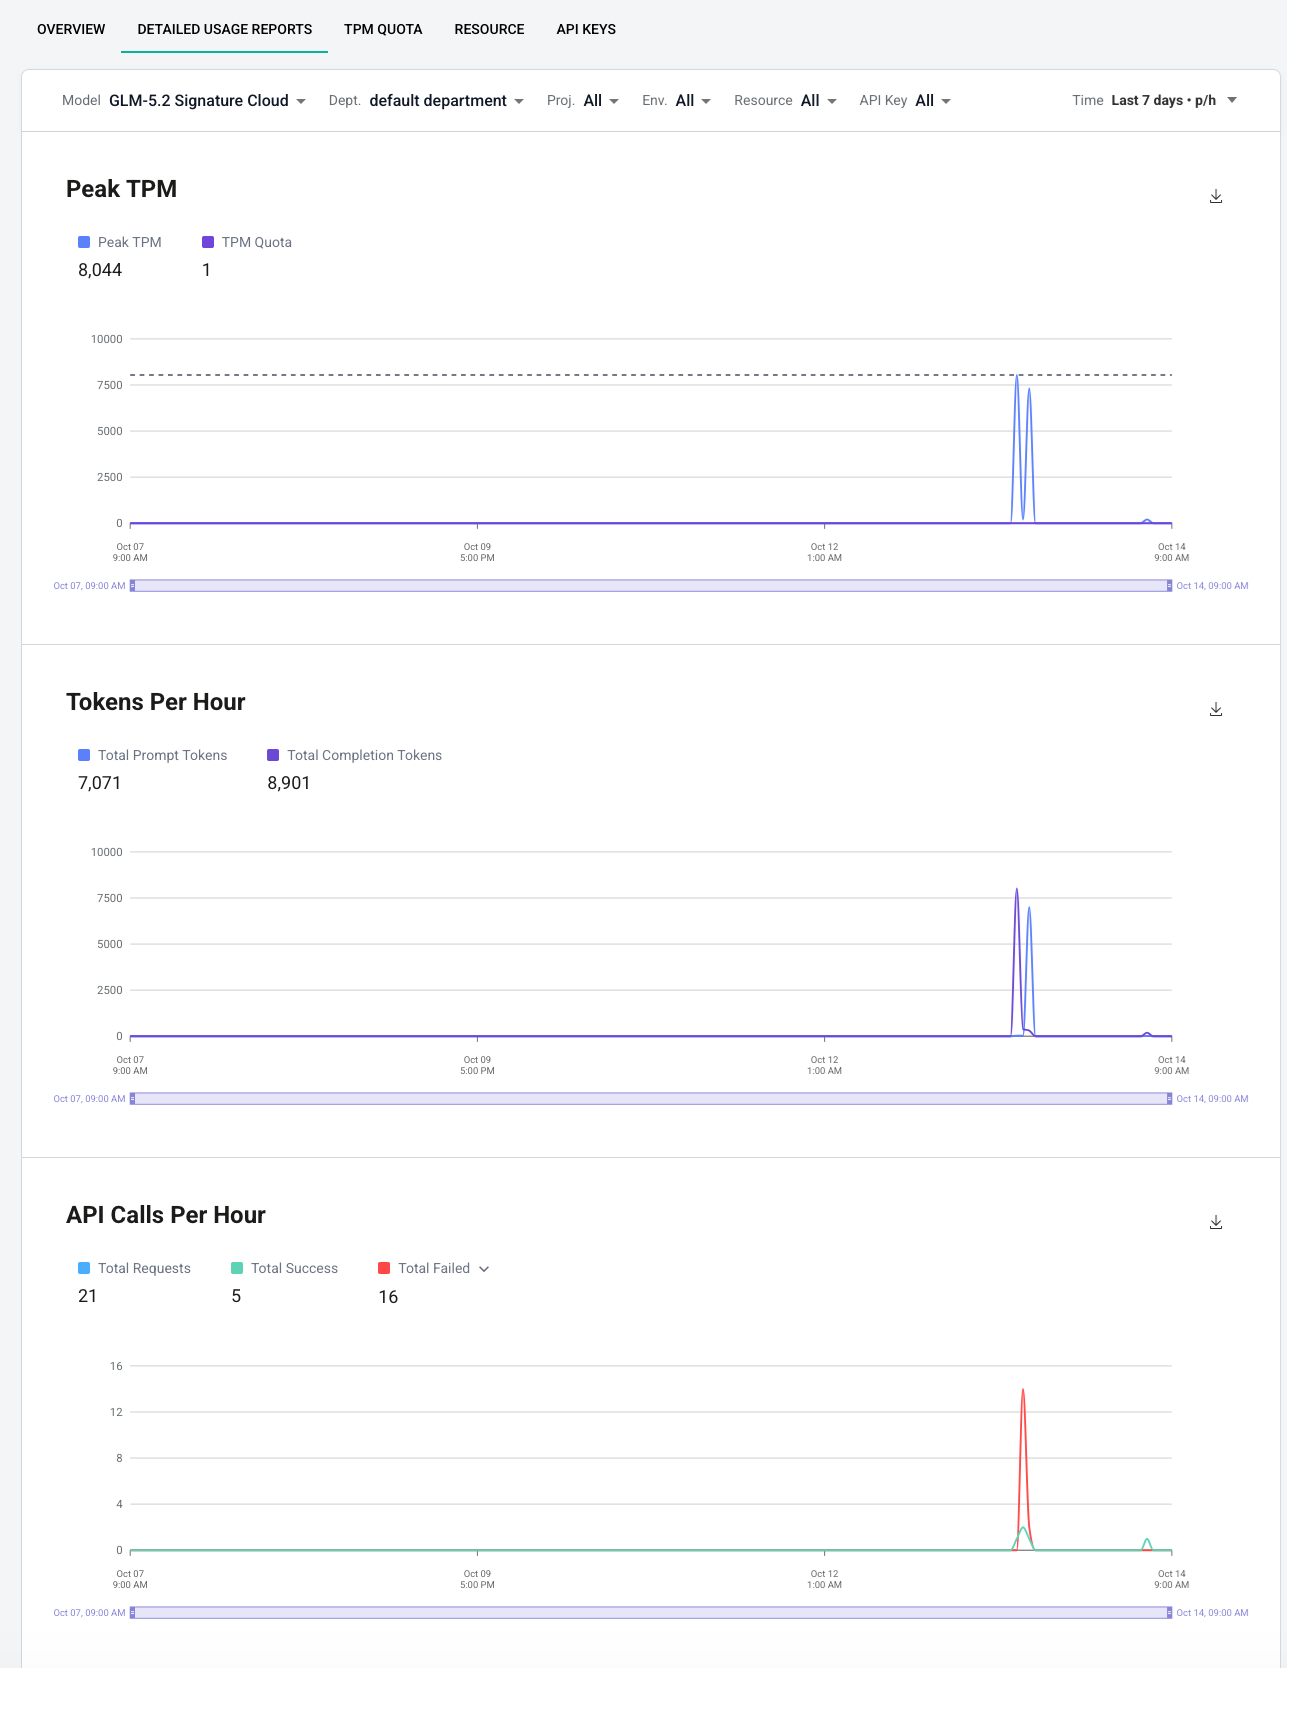
The tabs on the usage report provide the following information:
-
TPM Quota: Shows the token the model has and the allocated TPM to model resources.
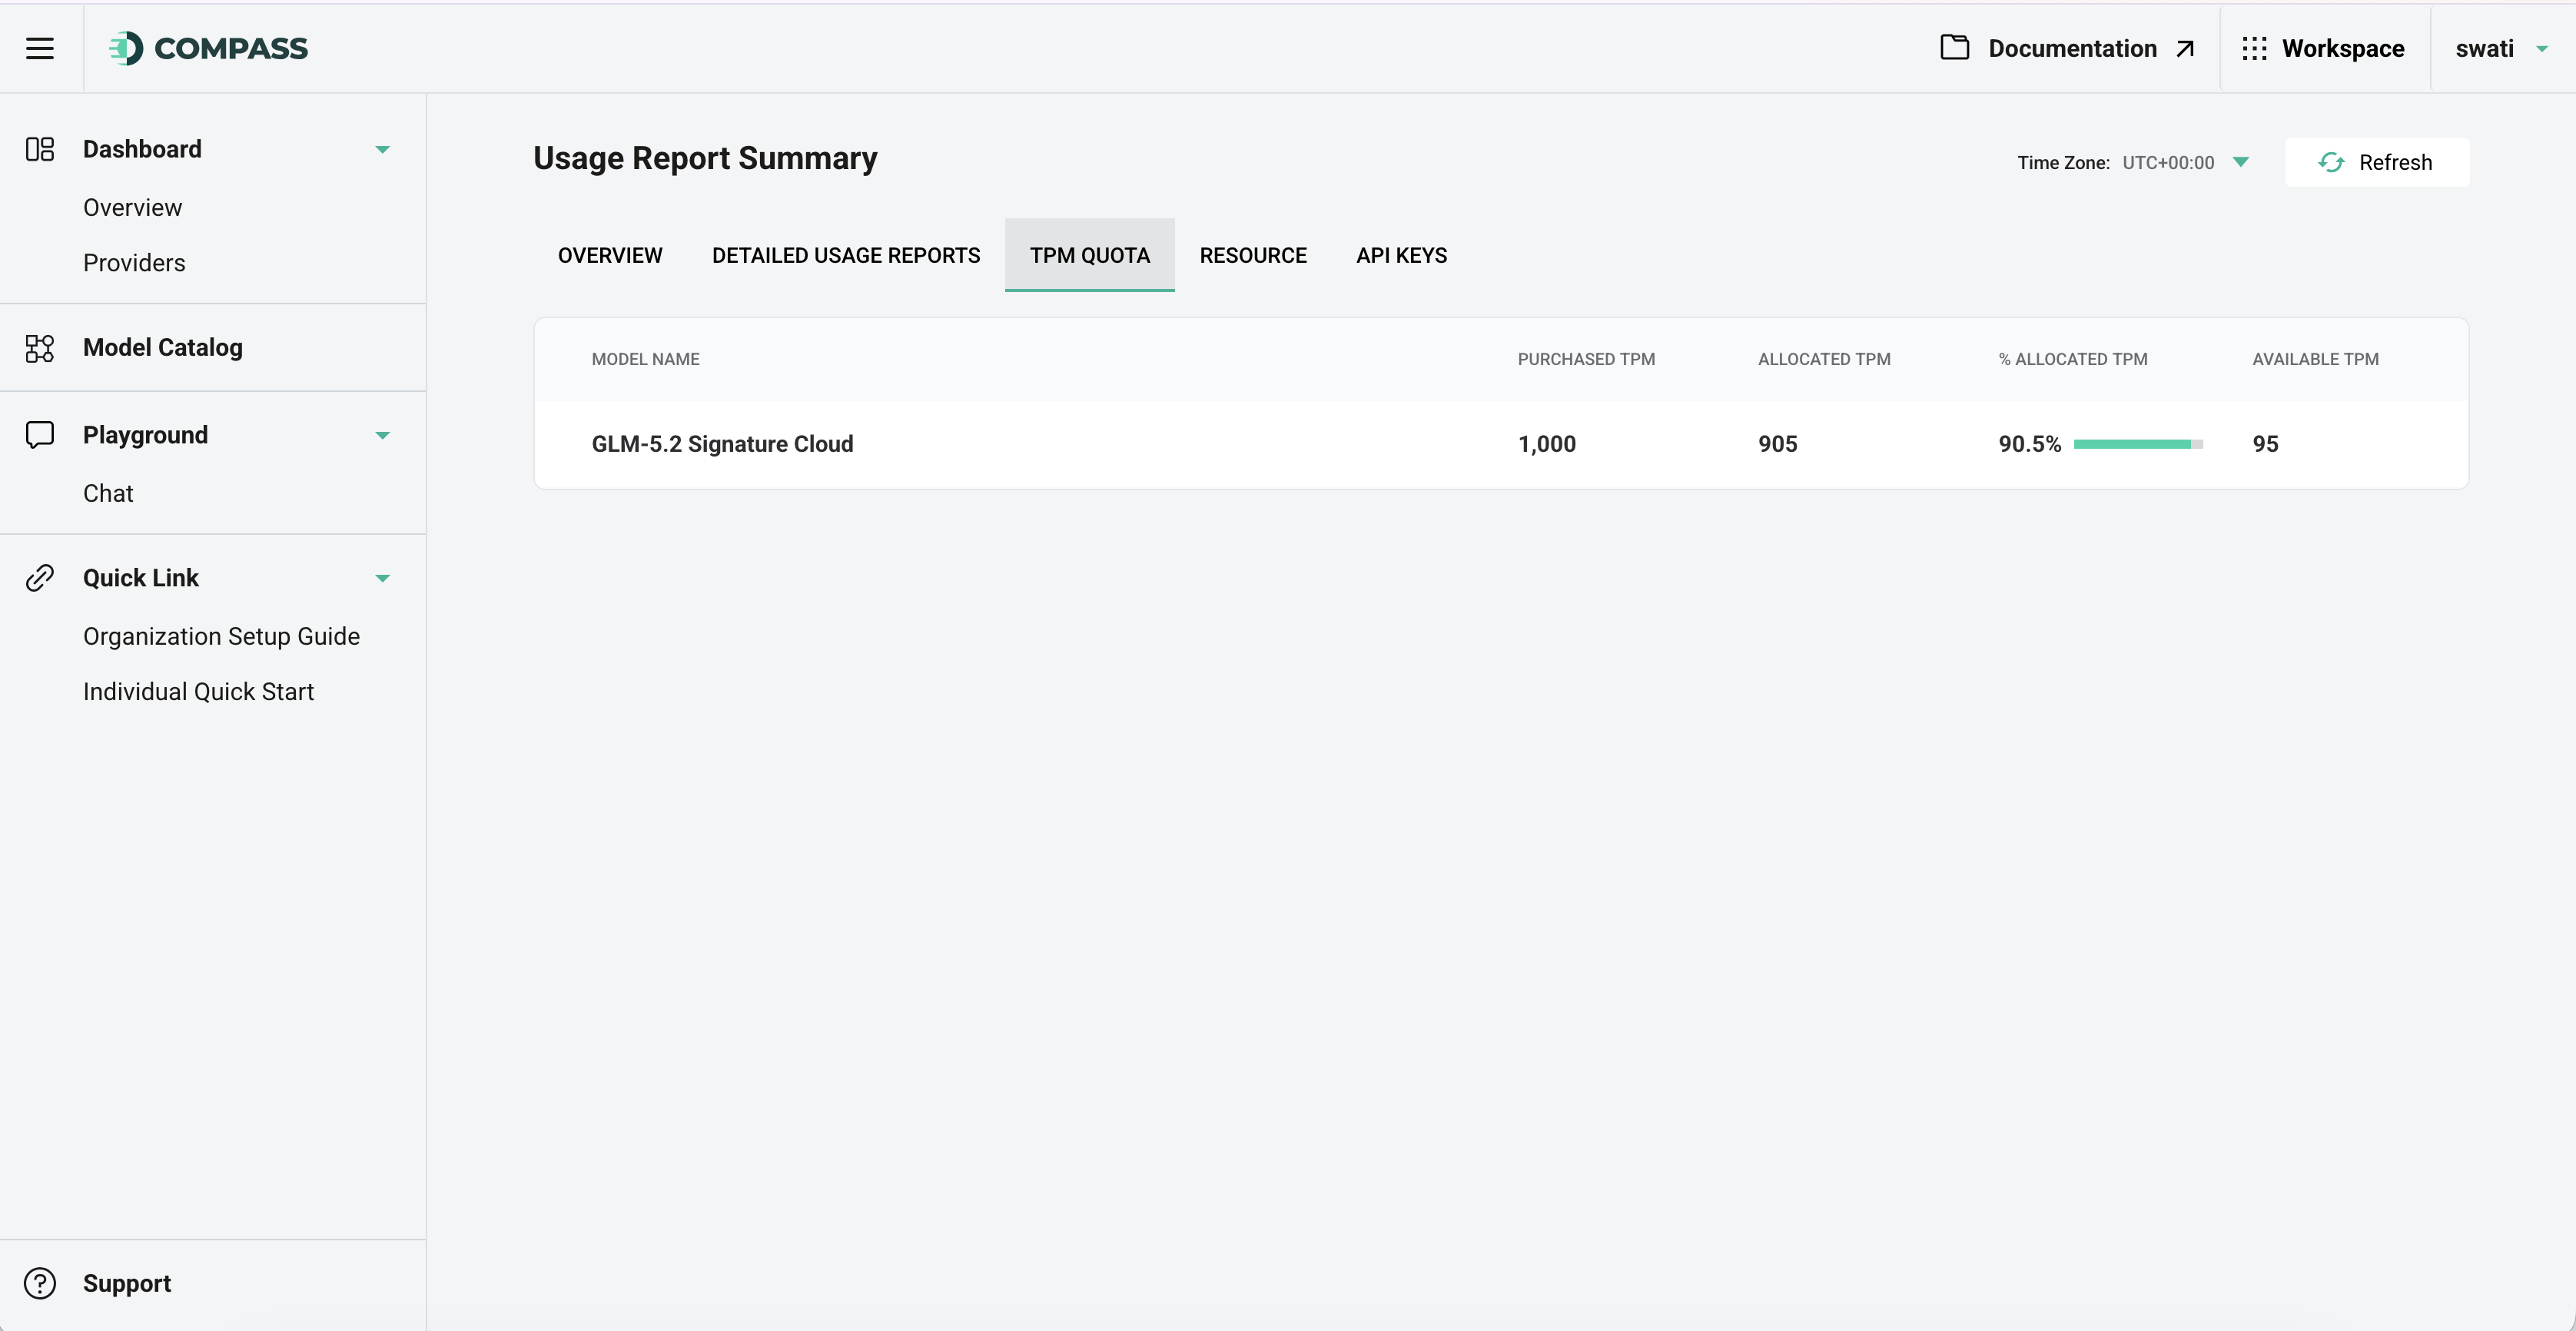
-
Resources: Provides the resource token usage information.
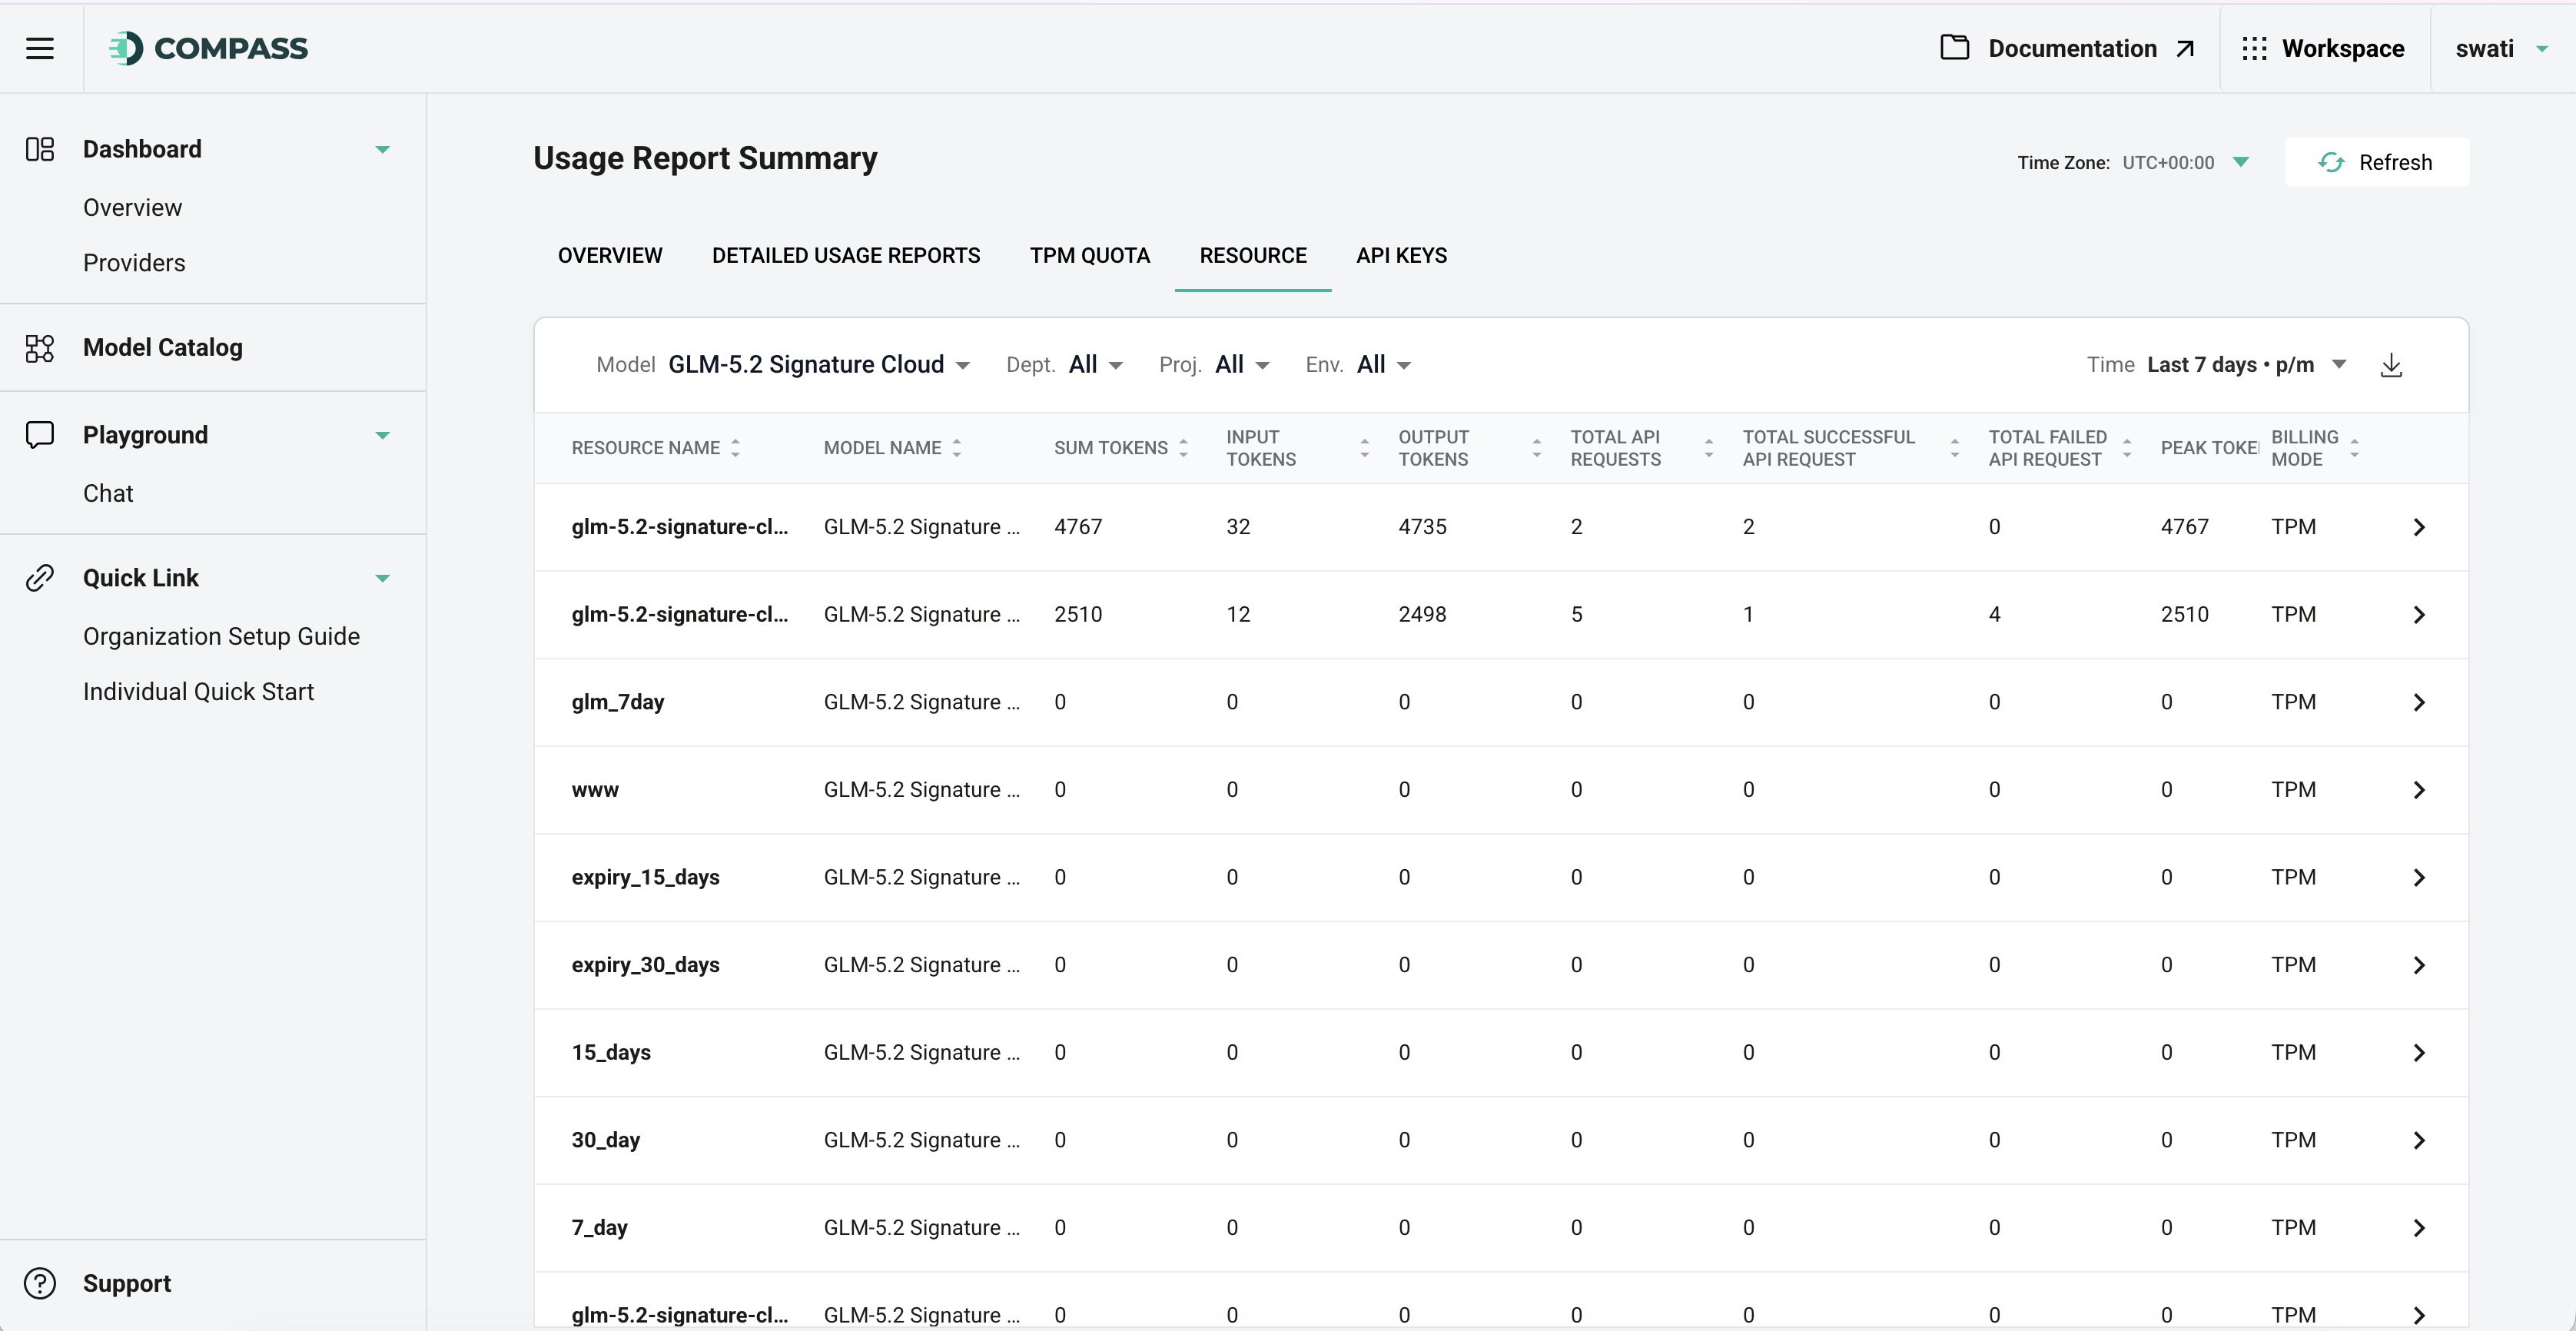
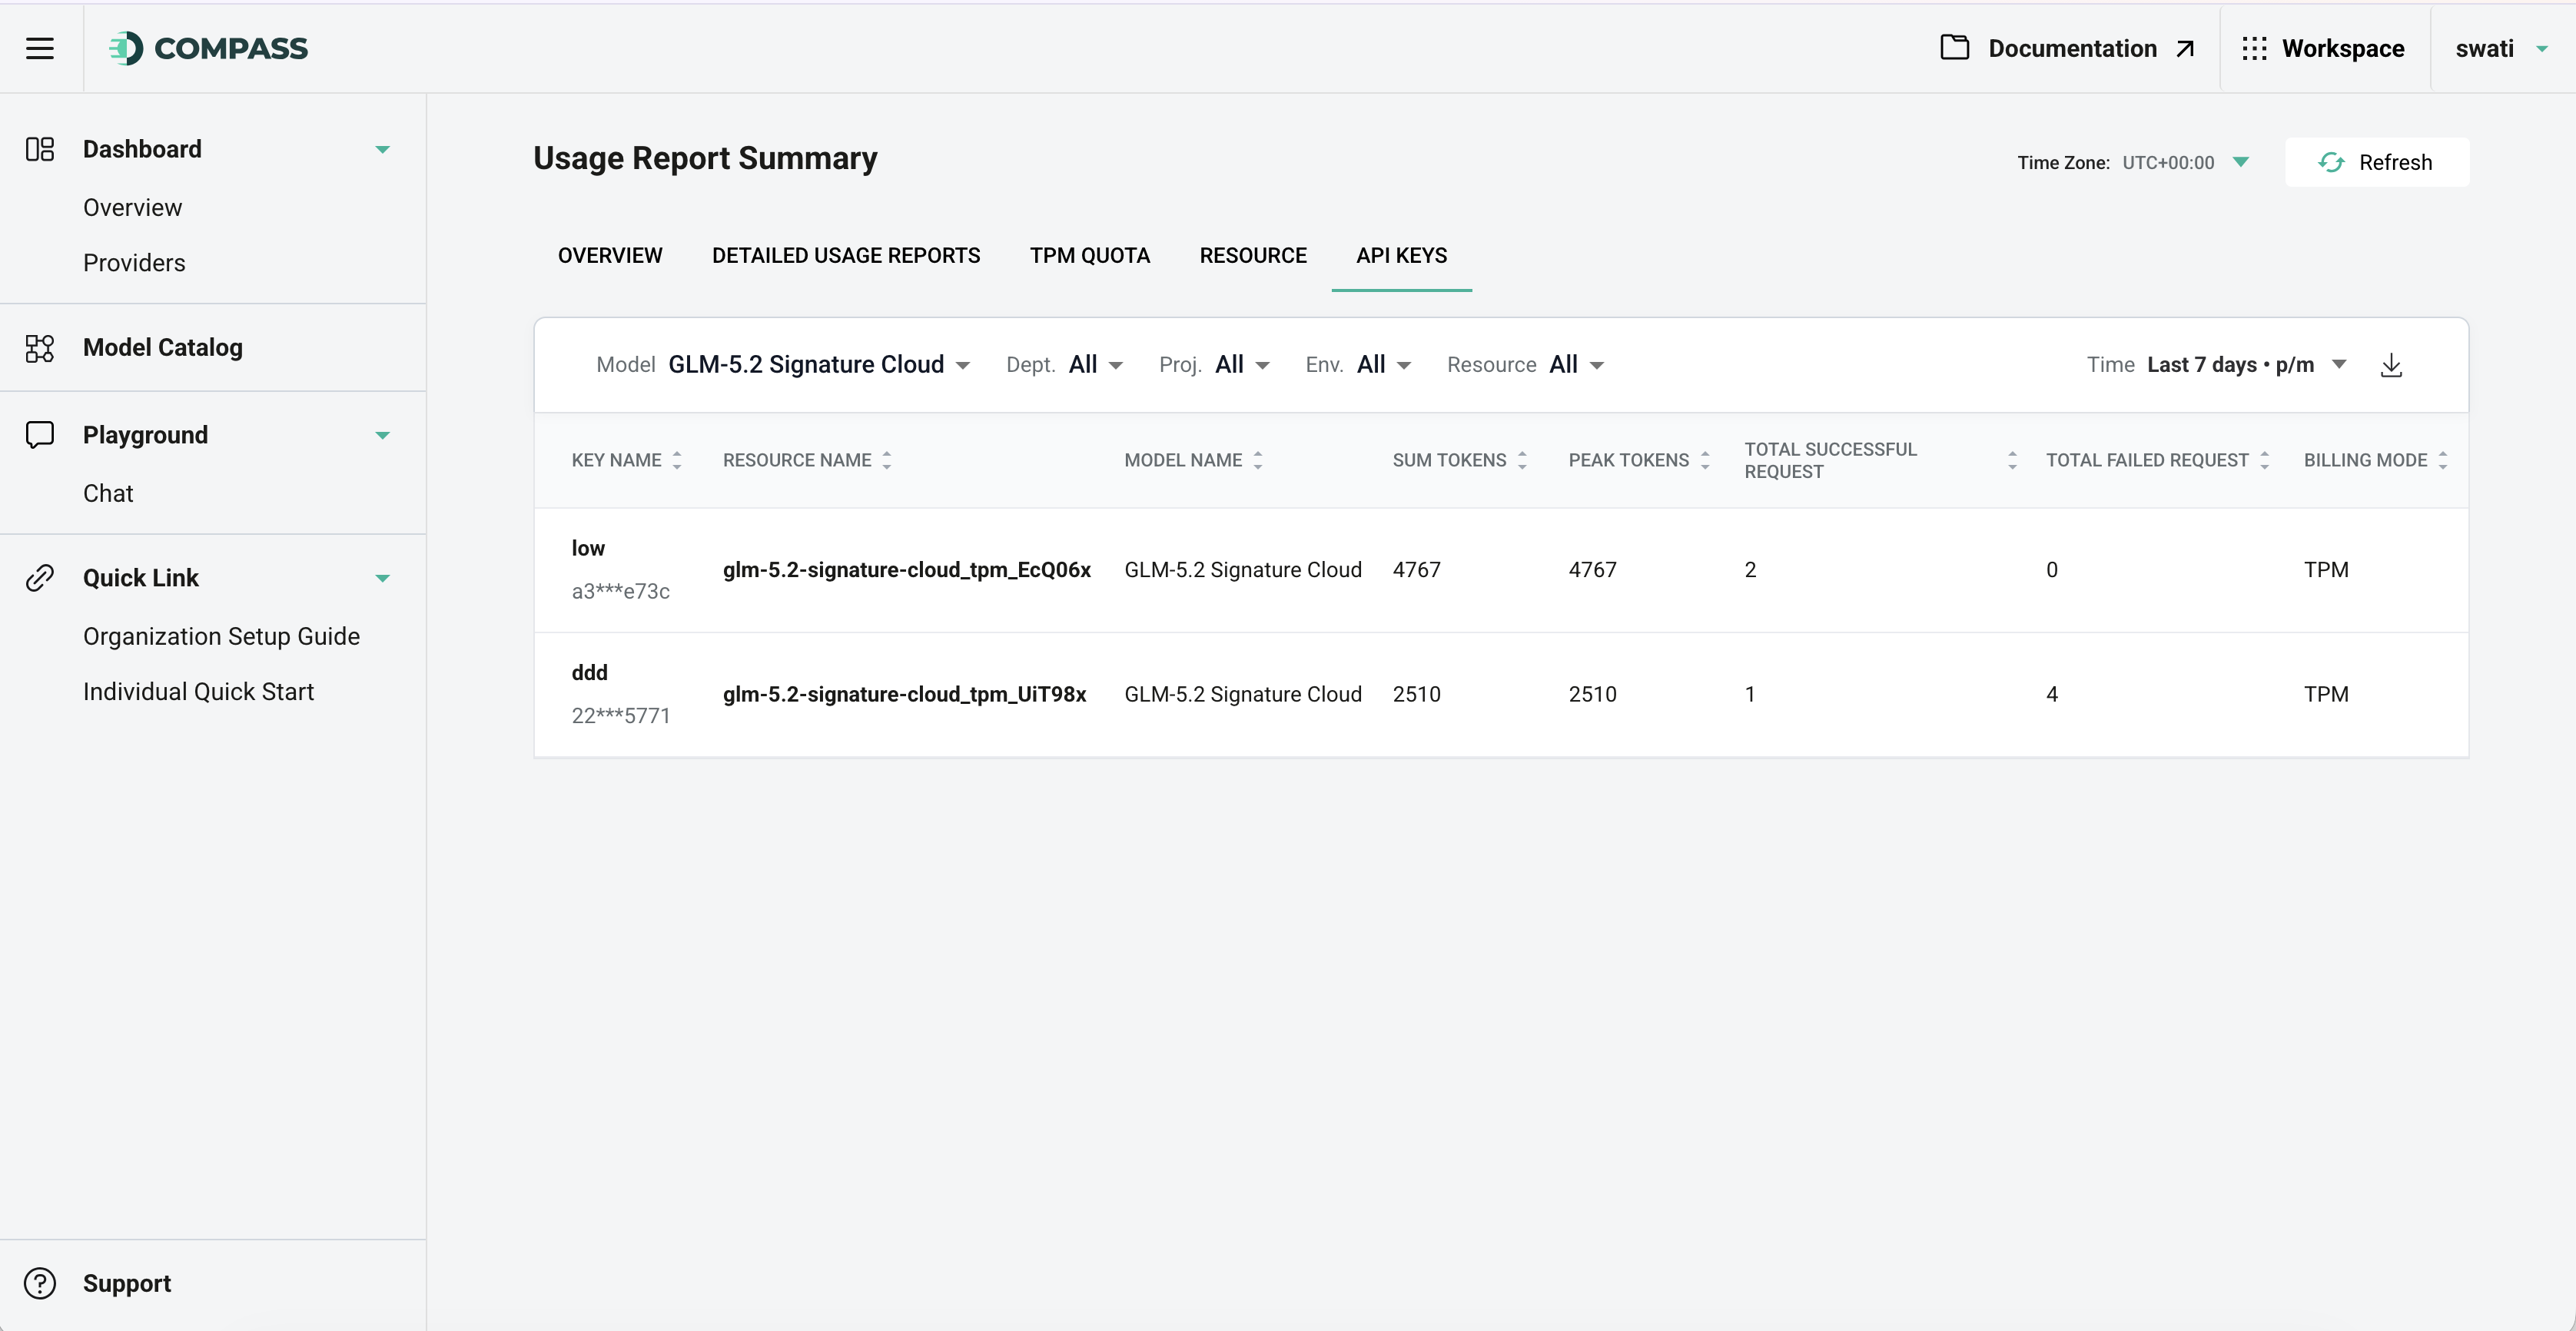
-
API Keys: Provides the API keys.
The Reports page also offers the flexibility to narrow down the usage results for the selected time duration, such as hours or days. Custom Period is also available to choose a specific time duration for viewing usage.
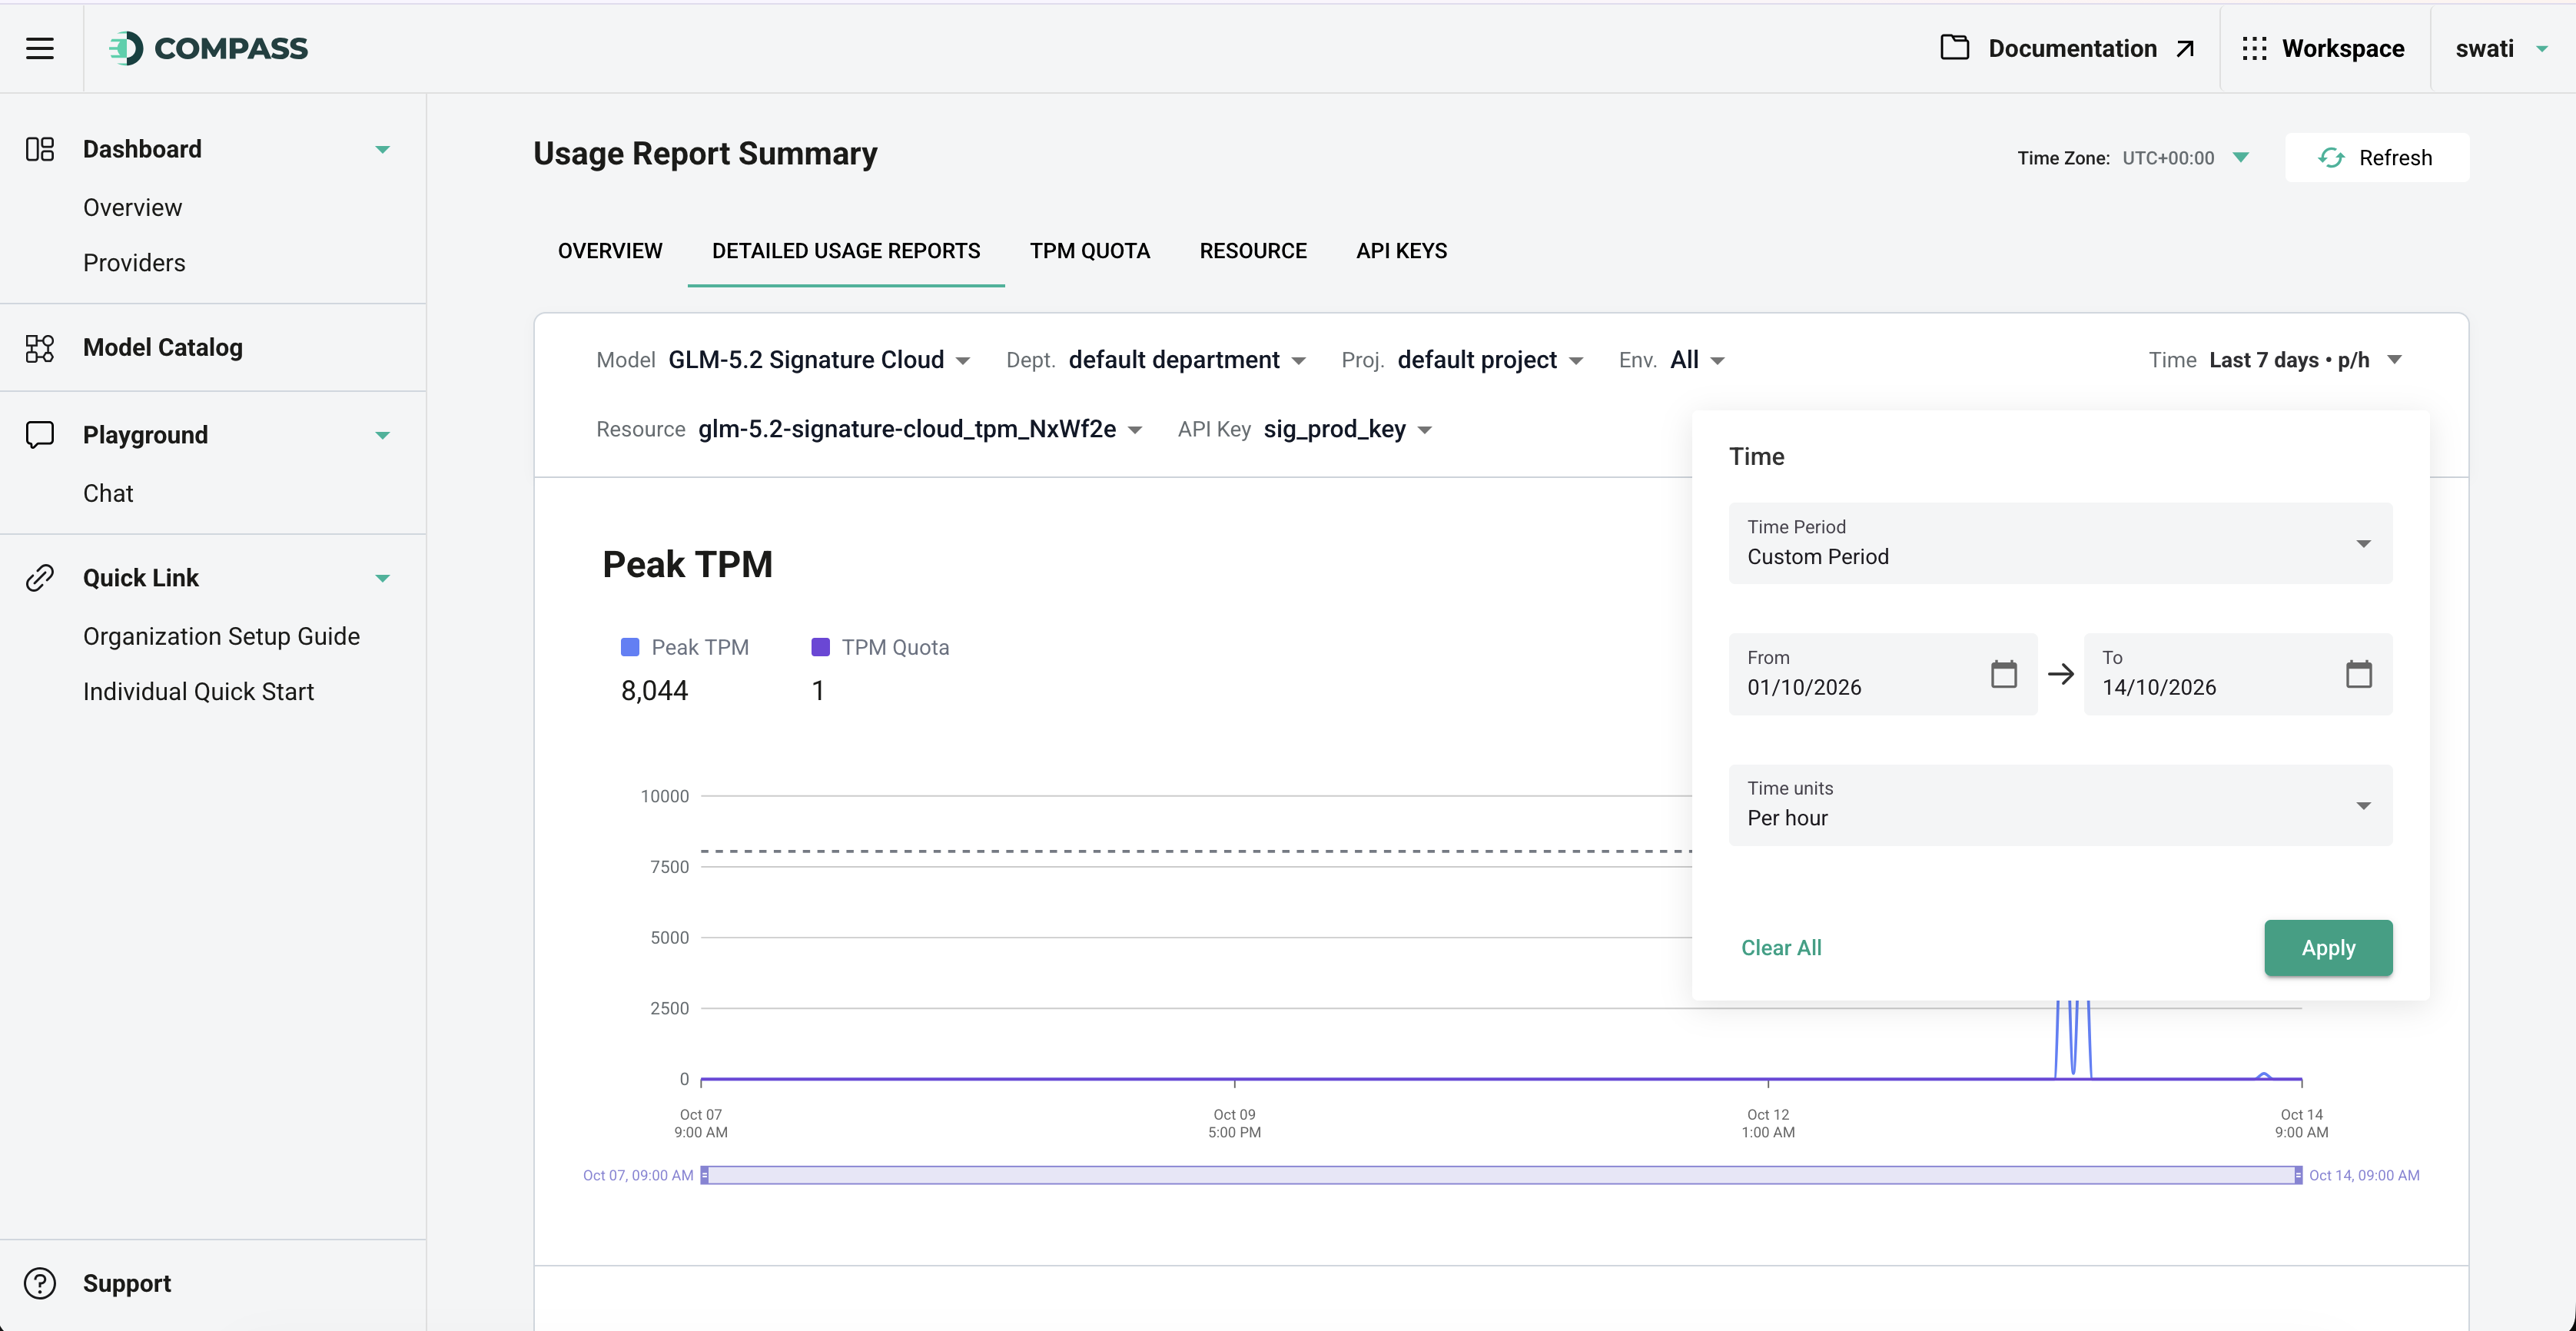
On this page, you can filter and view reports:
- Model
- Department
- Projects
- Resources Name
- API key
- Selected time duration
- For total token consumption
- About the status of API call details, such as successful and failed calls
Export Reports
Compass offers the option to export reports in CSV format. To do so, click the download icon at the top-right corner of each card.
You can also scroll the graph to view the granular data of the API calls.